 My Facebook news feed is total randomness seven days a week! I (Litsa) never know what will encourage me and/or speak to me—visually or through words!?! This week, I must say that this pie graph did just that—gave me a visual to hang on to through these winter months!?!
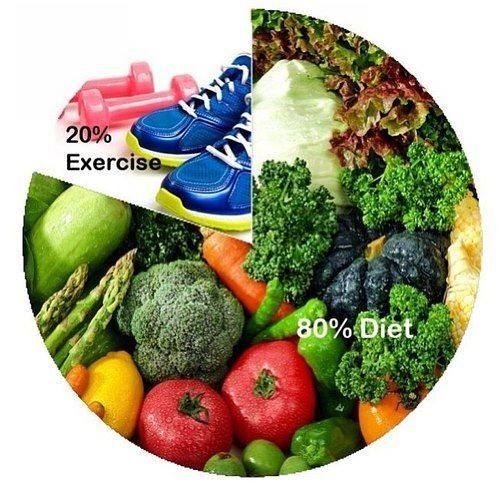
Kimberly Snyder posted this pie graphic on her Facebook page. It was perfect timing for me! I was thinking about National Pie Day in January just a few days ago. I wasn’t baking nor craving any particular pie to share but I was thinking of pie charts in regards to balancing life throughout the month…season….year. I wanted to stop to find a pie graph that visually spoke to me through BING’s photo images but I didn’t…time restraints to fit in EVERYTHING!! However, when this pie graph filtered its way into my newsfeed, I was h.a.p.p.y. indeed.
Power of Positive thinking!?! Do you believe in it!?! I do. Think and it will actualize itself—what are you thinking!?! Can you SEE your rewards!?!
Eating healthy foods is powerful! You feel the results immediately. Whether you are running and/or juicing, you’ll reap benefits—-even if your plan is only 20% exercise this week and 80% eating clean….keep going! Move more tomorrow…eat better today…the balance is there…
You’ll ROCK the individual “pie graph” of accomplishments—we need a variety of balance in our lives.
This one is a good start……..
Go 20/80!!
Latest posts by Litsa @How to Have it All (see all)
- Mushrooms: Portobello, Morels, & More - April 25, 2016
- Giving Back: Get Involved - December 2, 2015
- The Autumn Advantage - December 1, 2015